CTF Tools
Essential Tools and Techniques for Binary Analysis
In Capture the Flag (CTF) competitions, it is often necessary to analyze and manipulate binary files. Specialized tools can greatly simplify this process. In our Applied Binary Analysis course we encountered a variety of such tools, which I would like to present here.
Disclaimer
The information presented in this post is intended for educational purposes only and must not be used for any illegal activity. I explicitly distance myself from any misuse of this content for malicious or unlawful purposes. Unauthorized access to systems or the use of these techniques outside clearly permitted and controlled environments is illegal.Desktop Tools
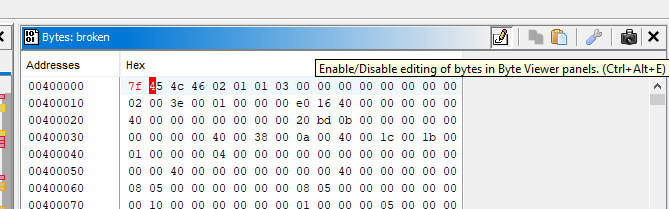
Hex Editor
A hex editor allows for byte-level editing of binary files. It is particularly useful if the editor shows both the raw data and its ASCII/UTF-8 representation. Many variants exist, for example as a VS Code extension or integrated within Ghidra.
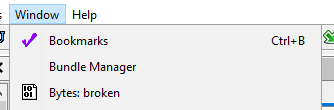
Hex Editor in Ghidra
The hex editor in Ghidra can be opened via the Bytes menu.
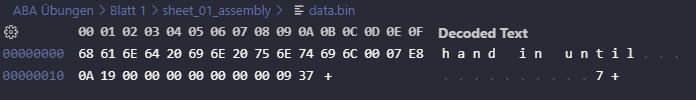
Hex Editor in VS Code
Ghidra
Ghidra is a reverse engineering tool developed by the NSA and open sourced since 2019. It offers features such as disassembly, code analysis, and graph generation, which makes it a versatile tool for binary analysis.
References
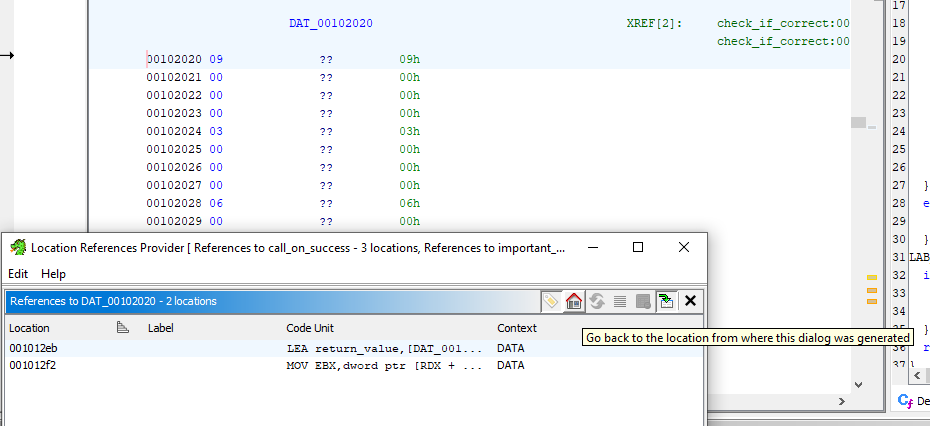
In Ghidra’s sometimes confusing decompilation view, references help to keep track of variable usage. A right-click on a variable and selecting "References" shows all its occurrences.
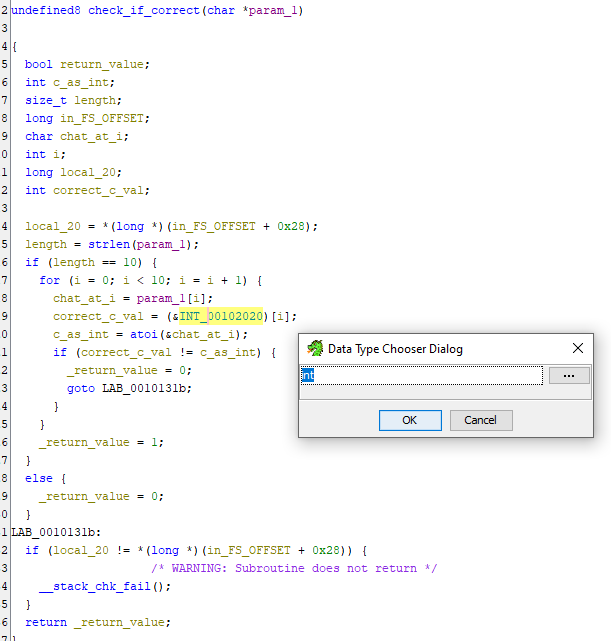
Renaming and Retyping Variables
Variables in Ghidra can be renamed and their types changed, which is an important step to better understand and comment the code. When a variable in C code is selected, you can rename it with L and change its type with CTRL+L.
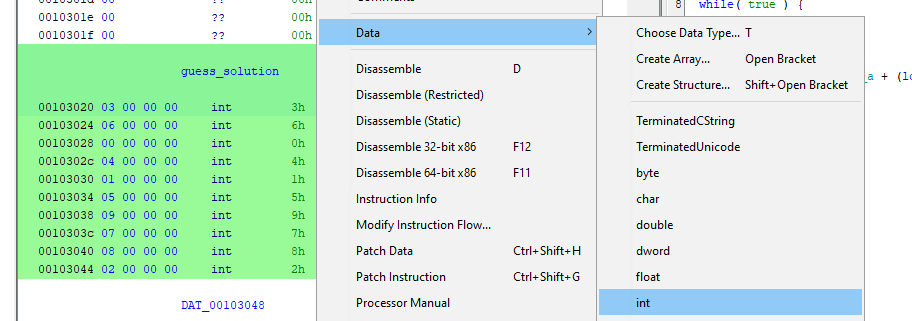
This also applies to variables in the assembly view. Choosing the appropriate type makes them easier to interpret.
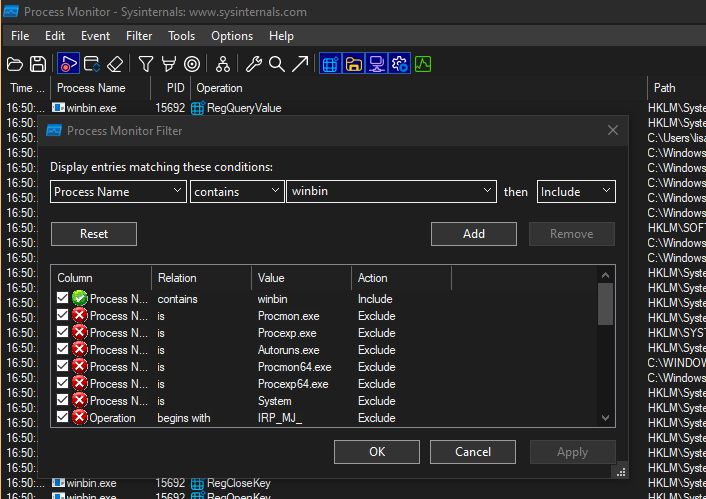
Process Monitor
Process Monitor is a Windows tool that monitors file system and registry activity. It can be used to see which files a program opens or writes.
strace and ltrace
On Linux, strace displays a program's system calls, while ltrace shows library calls. These tools help identify which files are accessed or which libraries are used.
Wireshark
Wireshark is a network analysis tool that monitors data traffic, revealing what data a program sends over the network.
gdb
gdb is a debugger for C and C++ programs that allows you to step through a program and inspect registers and memory.
gdb ./binary # Start gdb with binary
set disassembly-flavor intel # Set disassembly flavor to Intel syntax
break *0x1234 # Set breakpoint at address 0x1234
layout asm # Show assembly view
Important gdb commands:
- run: Starts the program
- break: Sets a breakpoint
- step: Executes the program step by step
- info registers: Displays the registers’ contents
- x/10x $rsp: Shows 10 words from the stack pointer
- layout asm: Displays the assembly view
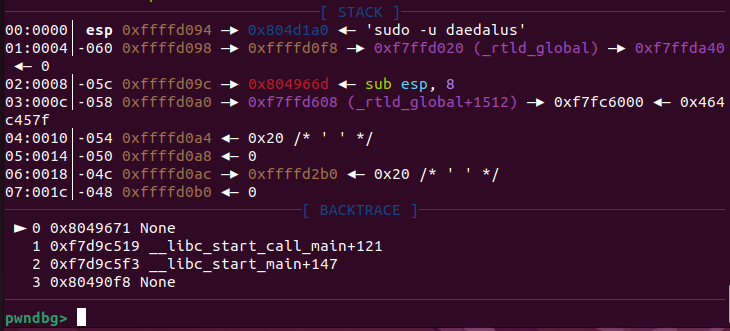
pwndbg
pwndbg is an extension for gdb that offers many additional features, such as enhanced display of registers and memory.
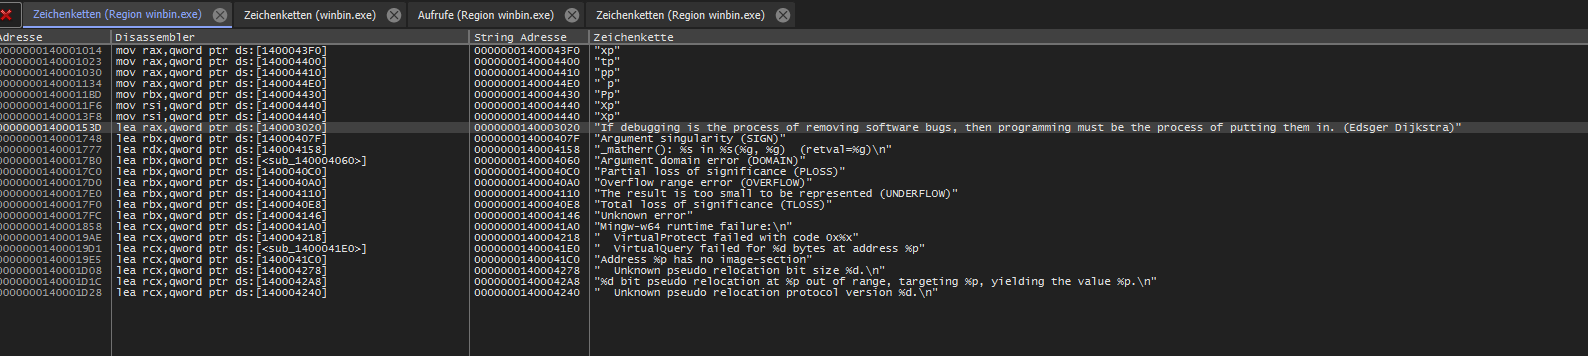
x64dbg
x64dbg is an open source debugger for Windows featuring a graphical interface that simplifies debugging. Analyzing the text within the program can help to get an initial orientation.
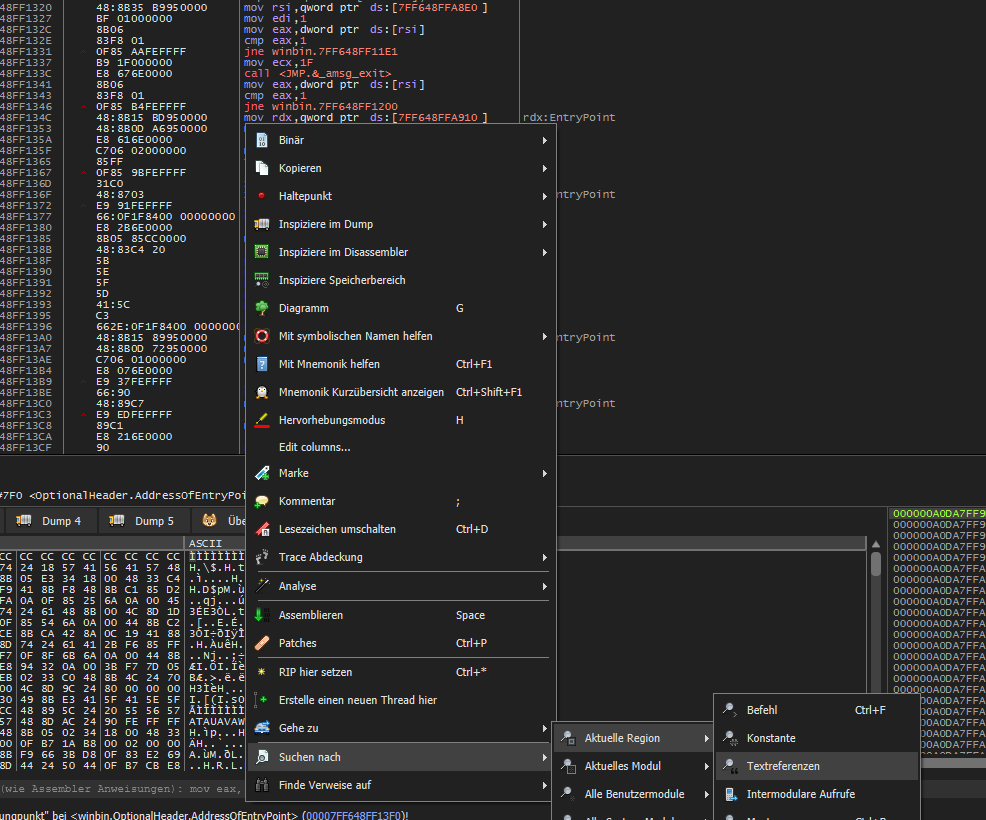
Breakpoints can also be set here:

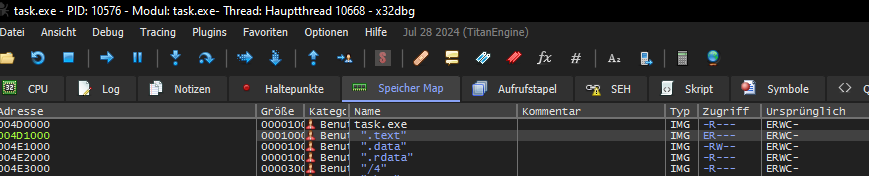
Ghidra with Debuggers
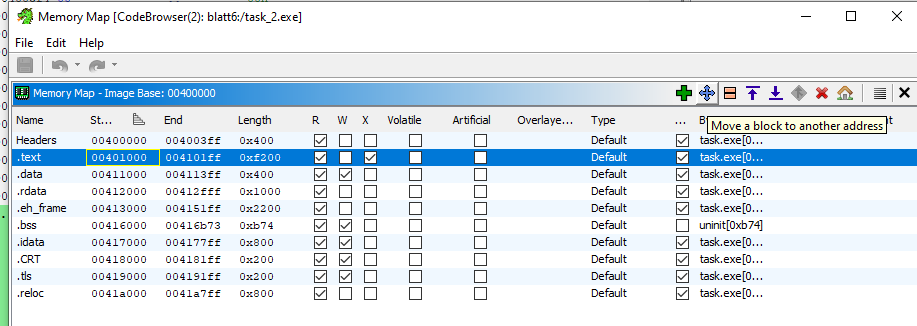
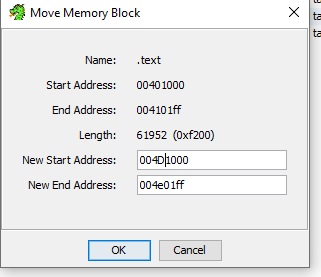
Ghidra can be used in conjunction with debuggers like x64dbg. It is important that the addresses in both tools match. If not, the .text section in Ghidra can be adjusted using data obtained from the debugger.
The .text section is then imported into Ghidra:
z3
z3 is an SMT solver used to solve mathematical problems. In binary analysis, it helps in finding variable assignments that satisfy certain program paths.
First, the program is statically analyzed (e.g. in Ghidra) to determine the conditions. Then z3 can provide an assignment for the variable input that meets these conditions.
undefined8 checK-flavour(char input)
{
  undefined8 uVar1;
  if ((((input < '0') || ('9' < input)) && ((input < 'b' || (input == '')))) &&
     ((((input < '>' || ('[' < input)) && ((input < ']' || ('_' < input)))) &&
      (((input < ' ' || ('#' < input)) && ((input < ')' || (',' < input)))))))) {
    uVar1 = 0;
  }
  else {
    uVar1 = 1;
  }
  return uVar1;
}
/*
only allow characters that are 0-9 or b- or >-[ or ]-_ ...
*/
from z3 import *

def check_characters(s: Solver, character: BitVec) -> None:
    s.add(
        Or(
            And(ord("0") <= character, character <= ord("9")),
            And(ord("b") <= character, character != 127),
            And(ord(">") <= character, character <= ord("[")),
            And(ord("]") <= character, character <= ord("_")),
            And(ord(" ") <= character, character <= ord("#")),
            And(ord(")") <= character, character <= ord(","))
        )
    )

s = Solver()
character = BitVec("character", 8)
check_characters(s, character)
s.check()
print(s.model())
The script outputs an assignment for the variable input that satisfies the conditions. It is crucial to use the correct types (e.g. an 8-bit BitVec) so that overflows behave as in the original program.
Ghidra for Native Libraries in APKs
In APKs, native libraries can be linked either dynamically or statically. In both cases, the libraries are analyzed as .so files in Ghidra. While dynamic libraries often display function names similar to those in Java, static libraries require locating methods such as JNI_OnLoad and the subsequent call to RegisterNatives to map functions.
void RegisterNatives(JNIEnv* env, jclass clazz, JNINativeMethod* methods, jint nMethods);
Android Tools
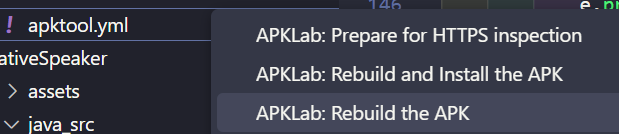
APKLab
APKLab is a tool for analyzing Android apps. It allows you to decompile, analyze, and modify the app’s source code. By using the decompile java flag, the Java code of an app can be extracted, and it can be used alongside an Android emulator to safely run and analyze the app.
Reading the Manifest
APKLab can extract the AndroidManifest.xml, which contains important information about the app such as permissions, activities, and services. This includes the launch activity.
<activity-alias android:exported="true" android:name="com.google.android.youtube.app.honeycomb.Shell$HomeActivity" android:targetActivity="com.google.android.apps.youtube.app.watchwhile.MainActivity">
    <intent-filter>
        <action android:name="android.intent.action.MAIN"/>
        <category android:name="android.intent.category.DEFAULT"/>
        <category android:name="android.intent.category.LAUNCHER"/>
    </intent-filter>
Smali Code
The smali code of an app, which represents its assembler code, can be viewed and modified with APKLab. Afterwards, the app can be repackaged into an APK file.
Comments
Feel free to leave your opinion or questions in the comment section below.